

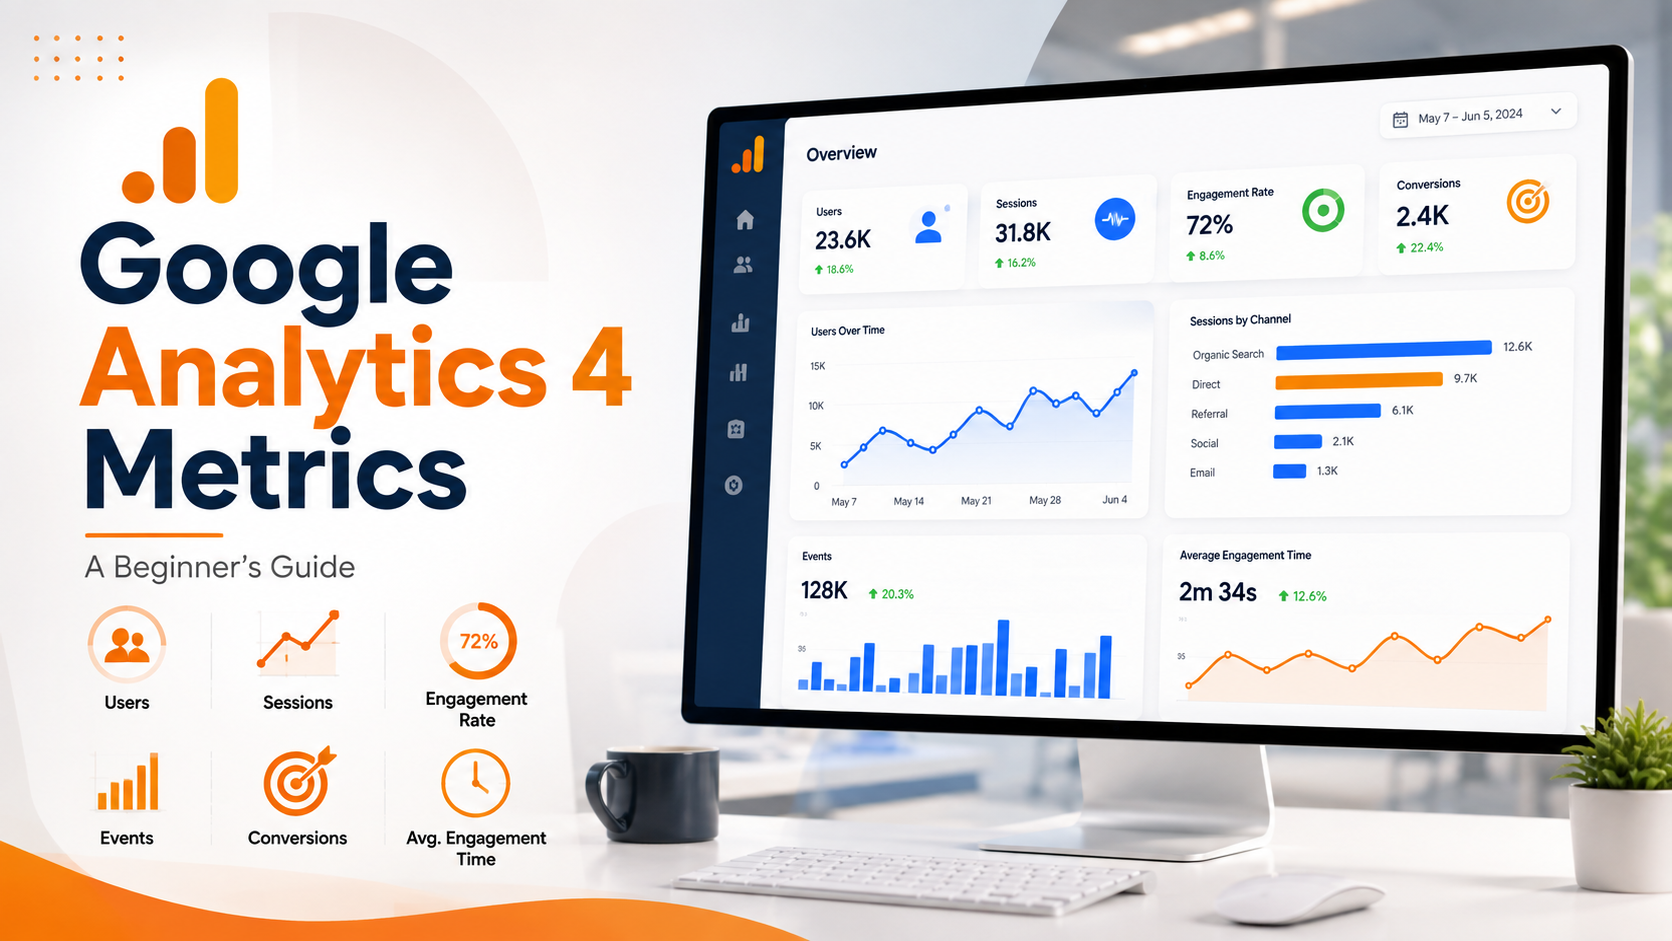
Google Analytics 4 Metrics Explained for Beginners
Understanding what visitors do on your website is important for improving traffic, content, marketing campaigns, and conversions. Google Analytics 4 Metrics help you understand how people discover your website, how they interact with it, which pages they view, and whether those interactions contribute to your business goals.
Google Analytics 4, commonly called GA4, uses an event-based measurement model. Instead of looking only at traditional page visits, GA4 can measure actions such as clicks, scrolling, video engagement, purchases, form submissions, and other interactions. This gives website owners a more detailed view of the complete user journey.
If you are new to GA4, the number of reports and metrics can initially feel confusing. The good news is that you do not need to understand every metric at once. Start with the core measurements and learn how they connect to your business objectives.
This beginner-friendly guide explains the most important Google Analytics 4 Metrics and how you can use them to make better marketing decisions.
What Is Google Analytics 4?
Google Analytics 4 is Google's analytics platform for measuring user activity across websites and applications. It collects interactions as events and uses those events to build reports about users, engagement, conversions, and revenue.
For example, when someone visits a blog post, clicks a button, watches a video, submits an enquiry form, or completes a purchase, GA4 can use these interactions to understand what happened during that user's journey.
The key advantage is that GA4 moves beyond simply asking, "How many people visited my website?" It also helps answer questions such as:
- What did visitors do after arriving?
- Which pages attracted the most attention?
- How engaged were visitors?
- Which marketing channels generated conversions?
- Which actions contributed to revenue?
- Where did users leave the website?
Let's look at the important metrics beginners should understand.
1. Users
Users represent the number of users who interacted with your website or app during the selected reporting period.
This metric helps you understand the size of your audience. For example, if your website received 10,000 users during a month, it means GA4 identified 10,000 users according to its measurement and reporting methods.
Users are particularly useful when comparing traffic over time.
You can ask:
- Did our audience grow this month?
- Which marketing channel brings more users?
- Which landing pages attract new visitors?
- Is organic traffic increasing?
However, user volume alone does not tell you whether those visitors are valuable. A website can receive thousands of users but generate very few enquiries or sales.
2. Sessions
A session represents a period of user activity on your website or app.
Sessions help you understand how often people interact with your website. One user can have multiple sessions, so users and sessions are not the same thing.
For example, one person might visit your website in the morning and return later in the evening. Depending on GA4's measurement rules, these interactions can contribute to multiple sessions.
Sessions become more useful when combined with other metrics such as engagement rate, conversions, and traffic source.
3. Engaged Sessions
An engaged session is a session that meets GA4's engagement criteria. In general, a session is considered engaged when it lasts more than 10 seconds, includes a key event, or includes at least two page or screen views.
This metric is more meaningful than simply counting visits because it provides an indication that users actually interacted with your website.
For example, if a visitor lands on a blog article and spends several minutes reading it, that session can provide a stronger engagement signal than a visitor who leaves almost immediately.
4. Engagement Rate
Engagement rate shows the percentage of sessions that were engaged.
A simple way to understand it is:
Engagement Rate = Engaged Sessions ÷ Total Sessions × 100
Suppose your website receives 1,000 sessions and 700 of them are engaged. Your engagement rate would be 70%.
A higher engagement rate can indicate that your content and website experience are attracting meaningful interaction. However, you should always interpret the number in context. Different website types can naturally have different engagement patterns.
For example, a contact page might have a short visit but still successfully generate an enquiry.
5. Events
Events are one of the most important concepts in GA4.
An event represents an interaction or occurrence that GA4 records. Examples include:
- Button clicks
- Form submissions
- Video plays
- Scrolls
- File downloads
- Product purchases
- Page or screen views
GA4's event-based approach gives marketers more flexibility in measuring user behaviour.
For example, if you operate a service website, you might track clicks on a "Contact Us" button as an event. This allows you to understand whether visitors are taking actions that matter to your business.
6. Conversions and Key Events
Conversions are critical for understanding whether website traffic produces business results.
In current GA4 terminology, important events are generally referred to as key events. These are actions that you consider especially valuable to your business.
Examples include:
- Lead form submissions
- Purchases
- Phone number clicks
- Account registrations
- Demo requests
- Newsletter sign-ups
Instead of focusing only on traffic numbers, you can use these measurements to identify which channels, campaigns, landing pages, and user journeys contribute to valuable actions.
For an ecommerce website, a purchase may be the most important key event. For a service business, a qualified enquiry or consultation request may be more meaningful.
7. Pageviews
Pageviews indicate how many times pages were viewed.
This metric can help identify content that receives significant attention. If one blog post generates considerably more views than another, it may indicate stronger search visibility, social promotion, or audience interest.
But pageviews should not be considered a success metric by themselves.
A page with 20,000 views and no conversions may be less valuable to your business than a page with 2,000 views that generates a significant number of enquiries.
That is why it is useful to compare pageviews with engagement and key events.
8. Exits
An exit occurs when a user leaves your website after viewing a particular page.
Exit data can help you understand where users are finishing their website journey.
A high number of exits does not automatically mean that a page is poor. For example, someone may read a blog article, get the information they need, and leave naturally.
However, if users repeatedly exit from an important conversion page without completing an action, it may be worth investigating the page experience, content, navigation, or call-to-action.
9. Average Engagement Time
Average engagement time shows how long users actively engage with your website or app.
This can be particularly useful for content-heavy websites.
If a detailed guide has a high average engagement time, it may suggest that visitors are spending time consuming the content. If another page has very low engagement time, you may want to check whether the content matches the visitor's search intent.
Remember that longer engagement is not always better. A simple page can successfully satisfy a visitor's need quickly.
10. Bounce Rate
Bounce rate in GA4 is closely related to engagement rate. It represents the percentage of sessions that were not engaged.
In simple terms:
Bounce Rate = 100% − Engagement Rate
For example, if a page or segment has an engagement rate of 70%, its bounce rate is 30%.
Bounce rate should not be interpreted as "everyone who left after viewing one page." GA4's definition is based on whether the session was engaged.
This makes it important to understand the difference between traditional analytics interpretations and GA4's current measurement approach.
11. User Journey
The user journey describes the path visitors take through your website.
For example:
Google Search → Blog Article → Service Page → Contact Page → Enquiry
Understanding this journey can help you identify the pages and interactions that contribute to conversions.
A visitor may not convert on their first visit. They might read an educational article, return through another channel, view a service page, and eventually submit a form.
Looking at the journey gives you a broader understanding of how different pages work together.
12. Revenue
For ecommerce and monetized websites, revenue is one of the most important metrics.
Revenue tracking can help you understand the value generated by purchases and other monetized events.
You can use revenue information to compare different channels, campaigns, products, and user journeys.
For example, one advertising campaign may generate a large number of visitors but relatively little revenue, while another campaign may bring fewer visitors but produce significantly more sales.
This is why businesses should evaluate traffic quality and revenue rather than focusing solely on visitor numbers.
How Should Beginners Use GA4 Metrics?
The biggest mistake beginners make is trying to monitor every metric at the same time.
Instead, start by connecting your GA4 metrics to specific business questions.
For website traffic:
Focus on users, sessions, and traffic acquisition.
For content performance:
Look at page views, engagement rate, and average engagement time.
For user interaction:
Review events and engaged sessions.
For lead generation:
Focus on key events such as form submissions, calls, and enquiries.
For ecommerce:
Track purchases, revenue, and product-related activity.
This approach makes analytics much easier to understand.
GA4 Metrics vs Google Tag Manager
GA4 and Google Tag Manager are often confused because they are commonly used together, but they serve different purposes.
GA4 is primarily an analytics and measurement platform. It helps you analyze users, events, engagement, conversions, and revenue.
Google Tag Manager, on the other hand, is a tag management system that can help you deploy and manage tracking tags and configure certain tracking setups without repeatedly editing website code.
In a typical setup, Google Tag Manager can help send tracking information to GA4, while GA4 processes and reports on that information.
Understanding this distinction is useful when learning GTM vs GA4.
Why These Metrics Matter for SEO
SEO is not only about bringing more visitors from search engines. The quality of those visitors and what they do after arriving also matter.
For example, suppose an SEO campaign increases organic users significantly. That is a positive signal, but you should also examine whether those users engage with the content and complete important actions.
GA4 can help you connect SEO traffic with on-site behaviour.
You can examine:
- Organic users
- Organic sessions
- Engagement rate
- Landing page performance
- Key events
- Revenue
- User journeys
Combining GA4 with Google Search Console can provide an even broader view of search performance. Search Console helps you understand how your site performs in Google Search, while GA4 helps you understand what visitors do after reaching your website.
You can also explore related topics such as Google Search Console Social Content Tracking to understand how different sources contribute to your overall digital marketing strategy.
Final Thoughts
Learning Google Analytics 4 Metrics does not have to be complicated. Start with the fundamentals: users, sessions, engaged sessions, engagement rate, events, key events, pageviews, exits, average engagement time, bounce rate, user journey, and revenue.
The most important thing is not simply watching numbers increase or decrease. Instead, ask what each number tells you about your visitors and whether that behaviour supports your business goals.
For beginners, the best approach is to connect GA4 data with real questions: Which pages attract visitors? Which content keeps them engaged? Which channels generate leads? Where do users leave? Which journeys result in revenue?
Once you understand these relationships, GA4 becomes much more than a traffic-reporting tool. It becomes a practical resource for improving your website, content, SEO, marketing campaigns, and overall digital performance.
If you are continuing your analytics journey, learning Google Tag Manager Explained for Beginners alongside GA4 can also help you understand how tracking is implemented and managed.
Frequently Asked Questions :
The most useful starting metrics are users, sessions, engaged sessions, engagement rate, events, key events, pageviews, average engagement time, bounce rate, user journey, and revenue.
Users represent people who interact with your website or app, while sessions represent periods of activity. One user can have multiple sessions.
An engaged session generally lasts more than 10 seconds, includes a key event, or has at least two page or screen views.
Engagement rate is the percentage of sessions that were engaged. It is calculated by dividing engaged sessions by total sessions.
Yes. In GA4, bounce rate represents the percentage of sessions that were not engaged. It is effectively the inverse of engagement rate.